


In the ever-evolving landscape of software development and IT operations, DevOps monitoring and logging plays a crucial role in maintaining system reliability, optimizing performance, and ensuring rapid incident resolution. As businesses increasingly move towards continuous delivery and deployment models, the ability to monitor systems and collect actionable logs has become a foundational aspect of any successful DevOps strategy.
Understanding the Role of Monitoring and Logging in DevOps
Effective DevOps monitoring and logging is not just about tracking metrics or storing logs—it’s about gaining visibility into complex systems, identifying bottlenecks, and preempting failures before they impact users.
Why Monitoring and Logging Matter
In a DevOps culture, where code moves from development to production at a rapid pace, visibility becomes paramount. Monitoring helps track system health and application performance, while logging captures detailed events that provide context when things go wrong.
The Shift from Traditional to Modern Observability
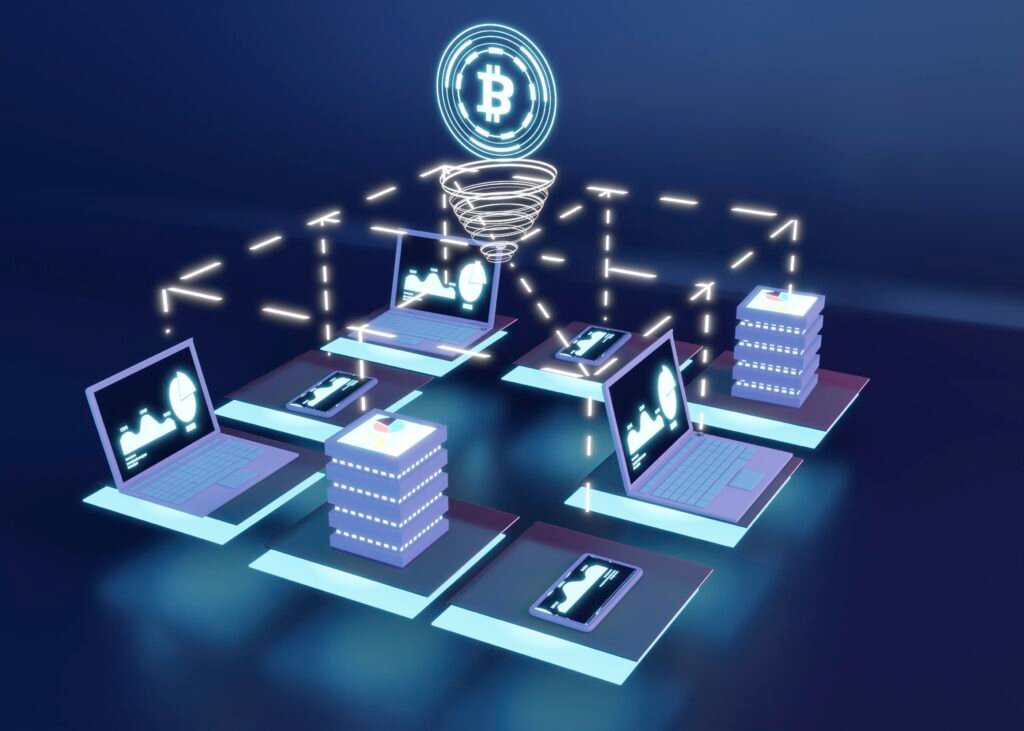
Modern DevOps doesn’t just stop at monitoring and logging—it embraces observability in DevOps. Observability expands the scope to include metrics, traces, and logs (often referred to as the “three pillars”) and allows teams to understand internal states from outputs, thus enabling deeper root cause analysis and faster incident resolution.
Key Components of DevOps Monitoring and Logging
A robust approach involves more than just collecting data. It requires correlation, context, and actionability.
Metrics
Metrics are quantitative data points such as CPU usage, request rate, and error counts. These are essential for real-time performance monitoring and trend analysis.
Logs
Logs provide qualitative data—textual records of events that occur within the system. They are essential for post-mortem analysis and compliance audits.
Traces
Traces follow the flow of a request across multiple services, enabling better understanding of latencies and pinpointing performance bottlenecks in microservices architectures.
Essential Tools for DevOps Monitoring and Logging
Choosing the right tools can make or break your observability strategy. Below are some widely used platforms categorized by functionality.
Log Aggregation Tools
Handling logs from diverse sources requires efficient log aggregation tools. These tools centralize log data, making it easier to search, visualize, and alert.
- ELK Stack (Elasticsearch, Logstash, Kibana): A powerful open-source suite for searching and visualizing log data.
- Fluentd: An open-source data collector that unifies logging layers.
- Graylog: Offers a user-friendly interface for log aggregation and alerting.
- Splunk: A premium platform offering real-time log analytics with robust machine learning capabilities.
Real-Time Performance Monitoring Tools
To ensure system health, real-time performance monitoring tools provide dashboards and alerts based on live data.
- Prometheus + Grafana: Prometheus collects metrics and Grafana provides interactive dashboards.
- Datadog: A comprehensive monitoring platform with integrations for cloud services and containers.
- New Relic: Offers full-stack observability with advanced analytics.
- AppDynamics: Great for application-level performance monitoring, especially in enterprise environments.
Infrastructure Logging Tools
Infrastructure logging involves tracking events from servers, containers, and cloud platforms.
- AWS CloudWatch: Tailored for AWS environments, useful for log collection, metrics, and alarms.
- Google Cloud Operations Suite (formerly Stackdriver): Provides infrastructure monitoring for GCP.
- Syslog-ng: A flexible, open-source solution for Unix and Linux systems.
Best Practices for DevOps Monitoring and Logging
To fully leverage DevOps monitoring and logging, teams must go beyond tooling and adopt strategic best practices.
Centralize Your Logs
Centralization improves accessibility and analysis. Instead of digging through logs across multiple systems, use log aggregation tools to consolidate them in one place.
Implement Structured Logging
Structured logs (JSON, key-value pairs) are easier to parse and analyze compared to unstructured logs. They also work well with automated tools and alerting systems.
Monitor What Matters
Track metrics that align with business and operational goals. Common examples include:
- Request latency
- Error rates
- User activity
- Resource utilization
Prioritize signals over noise to avoid alert fatigue.
Set Up Real-Time Alerts
Real-time performance monitoring is only effective if it triggers timely responses. Set thresholds and create alert policies for critical events like server downtimes or increased error rates.
Embrace Observability in DevOps
Modern DevOps teams aim for high observability in DevOps, which means being able to ask and answer any question about the system’s behavior. Invest in tracing tools, correlation engines, and AIOps to augment your monitoring and logging systems.
Ensure Log Retention and Compliance
Especially in regulated industries, it’s essential to manage log retention policies, access controls, and audit trails. Many tools provide built-in compliance features to assist with this.
Integrating Monitoring and Logging in CI/CD Pipelines
Monitoring and logging shouldn’t be afterthoughts—they must be integrated into every stage of the DevOps lifecycle.
Pre-Deployment Checks
Run tests that validate logs and metrics generated during staging. Automated checks should fail deployments that don’t meet logging standards or performance benchmarks.
Post-Deployment Monitoring
Monitor for regressions immediately after deployments. Tools like Datadog or New Relic can help identify slowdowns or errors introduced by new code.
Continuous Feedback Loops
Use the data from monitoring systems to inform future development. Trends in log data can reveal recurring issues or highlight features that impact performance.
Case Study: DevOps Monitoring and Logging in a Microservices Environment
Imagine a company that migrated from a monolithic architecture to a microservices model. With dozens of independently deployable services, observability became a challenge.
What They Implemented
- Prometheus & Grafana for metrics
- Jaeger for distributed tracing
- Fluentd + Elasticsearch for log aggregation
- Slack-integrated alerts for downtime and anomalies
The Outcome
The team reduced mean time to resolution (MTTR) by 45%, improved deployment confidence, and could proactively detect issues thanks to improved DevOps monitoring and logging practices.
Future Trends in DevOps Monitoring and Logging
The future of observability is bright and evolving rapidly.
AI-Driven Insights
Artificial intelligence is playing a growing role in anomaly detection and predictive analysis. Tools now automatically identify unusual patterns before incidents occur.
Serverless and Edge Monitoring
As infrastructure becomes more decentralized, new tools are emerging to monitor ephemeral resources like serverless functions and edge nodes.
Unified Observability Platforms
More organizations are opting for all-in-one platforms that combine metrics, logs, and traces—breaking down silos and improving cross-functional collaboration.
Unlocking DevOps Excellence with Alagzoo’s Full-Cycle Services
In today’s fast-paced digital landscape, businesses require agile, scalable, and reliable IT operations. Alagzoo stands out as a premier provider of comprehensive DevOps management services, designed to streamline software development and IT operations, enhancing efficiency and scalability for businesses.
Comprehensive DevOps Solutions
Alagzoo offers a full spectrum of DevOps engineering services, including:
- Containerization: Utilizing Docker and Docker-Compose to package applications and their dependencies, facilitating faster deployment and greater flexibility.
- Continuous Integration and Deployment (CI/CD): Implementing tools like Jenkins and GitHub Actions to automate the building, testing, and deployment processes, ensuring rapid and reliable software delivery.
- Infrastructure Automation: Employing Terraform to automate the provisioning and management of IT infrastructure, streamlining processes and reducing errors.
- Container Orchestration: Managing and deploying containerized applications using Kubernetes and Amazon EKS, enabling efficient scaling and management of applications.
- Service Mesh Implementation: Leveraging Istio for advanced networking features such as load balancing, traffic management, and service discovery within Kubernetes clusters.
- Monitoring and Logging: Integrating tools for real-time performance monitoring and log aggregation, enhancing observability in DevOps and ensuring system reliability.
Specialized AI and ML Services
Alagzoo extends its DevOps expertise to AI and ML operations, offering services like:
- AI-OPS & ML-OPS: Providing expertise in managing AWS SageMaker for building, training, and deploying ML models at scale.
- NLP & Computer Vision: Working with tools like AWS Comprehend and Rekognition to deliver solutions in natural language processing and computer vision domains.
Client-Centric Approach
Alagzoo’s commitment to excellence is reflected in its client testimonials:
“Alagzoo has been an outstanding partner. Their team is professional, knowledgeable, and customer-service driven.”
— John Labkins
“The Alagzoo team was a pleasure to do business with. Their responsiveness, courtesy, and efficiency are excellent.”
— Sara Takiedine
Why Choose Alagzoo?
- Expertise: A team of seasoned professionals with extensive experience in DevOps practices.
- Tailored Solutions: Customized DevOps strategies to meet specific business needs.
- Scalability: Services designed to grow with your business, ensuring long-term success.
- Reliability: Proven track record of delivering high-quality services on time.
Ready to Transform Your IT Operations?
Partner with Alagzoo to elevate your DevOps practices. Schedule a free consultation today and discover how our tailored solutions can drive your business forward.
FAQs
1. What DevOps services does Alagzoo provide?
Alagzoo delivers end-to-end DevOps solutions, including:
- Containerization: Utilizing Docker and Docker-Compose to package applications and their dependencies, facilitating faster deployment and greater flexibility.
- Continuous Integration and Deployment (CI/CD): Implementing tools like Jenkins and GitHub Actions to automate the building, testing, and deployment processes, ensuring rapid and reliable software delivery.
- Infrastructure Automation: Employing Terraform to automate the provisioning and management of IT infrastructure, streamlining processes and reducing errors.
- Container Orchestration: Managing and deploying containerized applications using Kubernetes and Amazon EKS, enabling efficient scaling and management of applications.
- Service Mesh Implementation: Leveraging Istio for advanced networking features such as load balancing, traffic management, and service discovery within Kubernetes clusters.
- Monitoring and Logging: Integrating tools for real-time performance monitoring and log aggregation, enhancing observability in DevOps and ensuring system reliability.
2. How does Alagzoo ensure zero-downtime deployments?
Alagzoo employs Helm Charts for packaging Kubernetes configurations, enabling atomic updates and zero-downtime deployments. This approach ensures application stability and availability during updates.
3. Does Alagzoo offer AI and ML integration within DevOps?
Yes, Alagzoo extends its DevOps expertise to AI and ML operations, offering services like:
- AI-OPS & ML-OPS: Providing expertise in managing AWS SageMaker for building, training, and deploying ML models at scale.
- NLP & Computer Vision: Working with tools like AWS Comprehend and Rekognition to deliver solutions in natural language processing and computer vision domains.
4. How does Alagzoo support infrastructure automation?
Alagzoo utilizes Terraform for infrastructure automation, allowing for the provisioning and management of IT infrastructure through code. This approach streamlines processes, increases efficiency, and reduces errors.
5. How can I get started with Alagzoo’s DevOps services?
To begin, you can schedule a free consultation through their website. The process involves:
- Scheduling a Call: Arrange a time that works best for you.
- Discovery & Consultation: Discuss your needs to ensure full understanding.
- Proposal Preparation: Receive a tailored solution based on your discussion.