

Overview
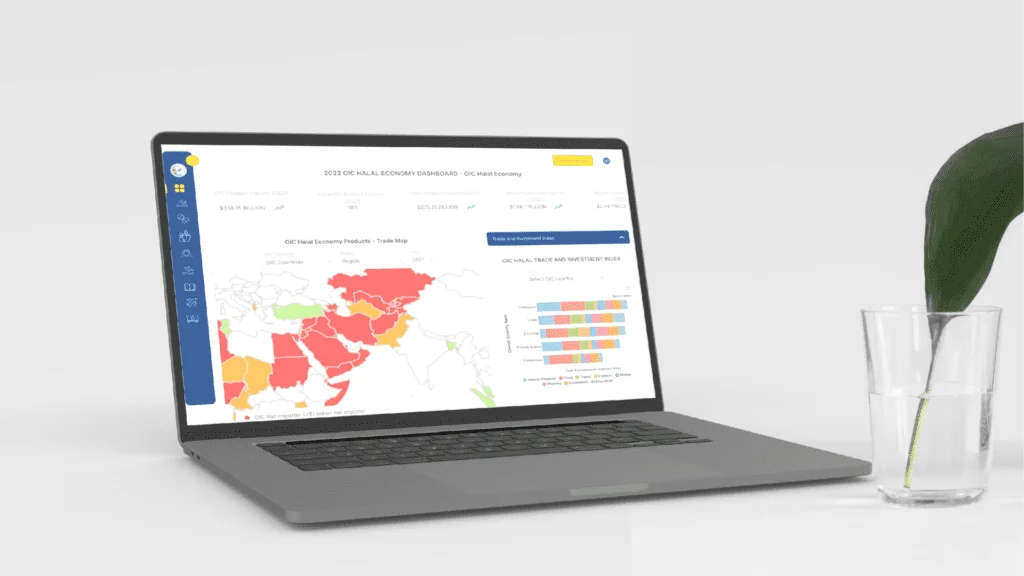
A prominent intergovernmental organization affiliated with the Organisation of Islamic Cooperation (OIC) engaged Alagzoo to design and develop a comprehensive Trade Information Dashboard.
The objective was to create an interactive digital platform that visually represents trade data among OIC member countries, across diverse commodities and sectors.
The platform aims to empower policymakers, economists, researchers, and trade professionals with intuitive access to complex trade datasets, facilitating better insights and more informed decision-making.
Challenges
Prior to engaging Alagzoo, the client faced several challenges:
- Trade data was fragmented across multiple sources and difficult to consolidate.
- Limited tools were available for visualizing trade flows across multiple countries and categories.
- The organization required a multi-layered data model to handle large datasets from varying timeframes and trade indicators.
- Ensuring the dashboard was accessible, multilingual, and easily interpretable for non-technical users.
- Building a solution that could be updated periodically with new trade data without requiring technical intervention.
- Multilingual Interface for Cross-Cultural Reach

Our Approach
Alagzoo adopted a data-driven and user-experience-first methodology, combining modern data engineering with elegant visual storytelling:
Data Architecture & Integration
1.
- Consolidated trade data from multiple official databases and repositories.
- Designed a scalable data warehouse capable of ingesting and updating trade statistics periodically.
Dashboard Design & Visualization Framework
- Created interactive visual layers using maps, pie charts, and bar graphs to show trade flows, import-export balances, and commodity trends.
- Implemented dynamic filters for countries, time periods, and product categories.
2.
Technology Implementation
- Built the platform using ReactJS for the front-end and Python (FastAPI) for the backend.
- Employed PostgreSQL with PostGIS for spatial data and D3.js / Plotly for visualization.
- Ensured the dashboard met accessibility and multilingual requirements for OIC audiences.
3.
Deployment & Handover
4.
- Deployed the dashboard on a secure cloud environment, ensuring performance optimization for large datasets.
- Conducted training sessions for the client’s research and analytics teams to independently manage updates.
Key Features Delivered
- Interactive Map View of Trade Between OIC Countries
- Time-Series Visualization of Trade Growth & Decline
- Country-Wise and Commodity-Wise Filtering
- Multi-Lingual Support (English, Arabic, French)
- Exportable Reports & Charts for Policy Use
- Admin Module for Periodic Data Updates
Results & Impact
- Provided the OIC with its first unified digital trade intelligence platform.
- Enabled policymakers and analysts to identify emerging trade opportunities and dependencies among member nations.
- Reduced manual data processing time by over 70%.
- Fostered collaboration among economists, trade analysts, and member-state ministries using a shared digital reference system.
- Positioned the platform as a flagship knowledge asset for economic development within the OIC ecosystem.
Takeaways & Technical Insights
This project highlights Alagzoo’s capability to:
- Transform complex global data into intuitive visual insights.
- Build scalable, policy-grade analytics platforms for intergovernmental use.
- Blend data engineering, visualization, and UX design to create accessible intelligence tools.
- Deliver solutions that enhance decision-making in global trade and economic development.
